
Liza Gross in PLoS Biology. This Journal is under CC-AL, CC BY 3.0 <https://creativecommons.org/licenses/by/3.0>, via Wikimedia Commons
Science of Chess: Networks for expertise in the chess player's brain
Chess can be an important way of investigating how learning and expertise are manifest in the nervous system
There are a lot of specific reasons why you might be interested in the science of chess, but I think in general these can be grouped into two broad categories. On one hand, you might think that studying the cognitive and neural processes that support playing chess will help you understand the game and how we play it. You might be interested in evidence-based techniques for improving chess ability, for example, or maybe you want to examine the role of memory and recall vs. spatial processing in expert play. What defines this category is treating chess itself as the object of study: What is this game? What are we doing when we play it?
On the other hand, you could also be interested in the science of chess because the game offers you a pathway to studying something else that you want to understand. That is, you might want to examine chess because it has some neat properties that make it just the right vehicle for a deep dive into your real interest. I think Alexander Kronrod's famous quote "Chess is the drosophila of artificial intelligence" is probably one of the best expressions of this perspective. Drosophila melanogaster, also known as the fruit fly, is a perfectly interesting little organism, but it's real value to science is as a model organism for genetics. Fruit flies don't have a lot of chromosomes, have a short life cycle, and reliably have a lot of offspring. Those three properties mean that a genetics researcher can observe what happens over several generations of fruit flies pretty quickly and can also benefit from all the things we know about the fruit fly connectome, its genome, and its development to ask targeted scientific questions.

The humble fruit fly hanging out on a banana. By Sanjay Acharya - Own work, CC BY-SA 4.0, https://commons.wikimedia.org/w/index.php?curid=63862733
Like the fruit fly, chess also has a number of properties that make it great for asking questions about other things (including artificial intelligence). The game is rich, but has a clear set of rules that constrain how we play. There is also no hidden information in chess, so if you're interested in judgment and decision-making you don't need to cope with uncertainty and all the complications that adds to understanding cognition. From the standpoint of a scientist who is interested in how people play the game, it's also especially handy that there are multiple rating systems that offer a quantitative estimate of playing strength. Whether you prefer ELO or Glicko-2, ratings save the behavioral scientist a ton of work by providing a straightforward answer to the question, "How good is this player?" Finally, perhaps the most useful property of chess for the cognitive scientist or the neuroscientist is that thousands of people around the world voluntarily play chess all the time. Together, these features of the game (among others!) make chess a wonderful model organism for learning new things about the mind and the brain.
Using chess to understand expertise in the brain
The study I want to tell you about is a great example of researchers using chess as a vehicle for asking and answering some intriguing questions about expertise. This one caught my eye in particular partly because one of the authors (Dr. Hans Op de Beeck) worked as a post-doc at MIT during my time there as a graduate student (Hans in Dr. Jim DiCarlo's lab, me in Dr. Pawan Sinha's). We're both very interested in visual recognition and how experience and expertise affects how recognition works and I was stoked to see that we both apparently also think chess is worth thinking about scientifically.
This paper has a ton of cool stuff in it, but a lot of it is also very technical. I'm going to do my best to talk about some of their key results by introducing you to some analyses that are currently quite popular in modern neuroscience and cognitive science, but there are also a few things I'm going to leave out to keep the discussion here as accessible as possible to folks that don't have a background in data science. My hope is that I can give you a sense of some of the things they learned about how chess expertise translates into differences in neural processing and what that may mean for our understanding of expertise more broadly.
The goal of the study is largely to quantify how chess expertise changes the way chess positions are compared to one another both in terms of the explicit judgments players make (Which position do I think is better for me?) and in terms of how different cortical networks respond to those positions. What I thought was really neat about this study was the way the researchers built bridges between the brain, observers' understanding of chess positions, and those same chess positions considered on their own, independent from players' assessments of them. They achieve this by applying a tool called Representational Similarity Analysis (or RSA) which is a powerful means of comparing how different systems respond to a specific set of items. I'll give you a bit of primer on how this technique works while introducing you to their experimental design. We'll get started by talking about the chess positions that serve as the starting point for their work.
How similar are chess positions in theory?
To start asking questions about how experts' and non-experts' minds and brains evaluate chess positions, the researchers developed a carefully curated set of chess positions to use in their experiment. The nature of these positions is already a pretty cool thing to talk about because they built in a lot of neat structure across the 40 different boards they used here.
Specifically, these 40 positions were chosen so that each individual position could be assigned a label from one of three categories:
(1) Checkmate vs. Non-Checkmate, which is exactly what it sounds like - each position either would lead to a forced mate, or did not.
(2) Strategy - These are a little trickier to describe, but positions were also selected according to tactical motifs that were critical to the position. These included strategies like "Bishop-forcing moves" and "Knight-Bishop combinations" am
ong others.
(3) Visual Similarity - Each checkmate position had a non-checkmate partner that differed only by a single piece. As such, the visual appearance of these pairs was closely matched while changing the tactical outlook substantially.
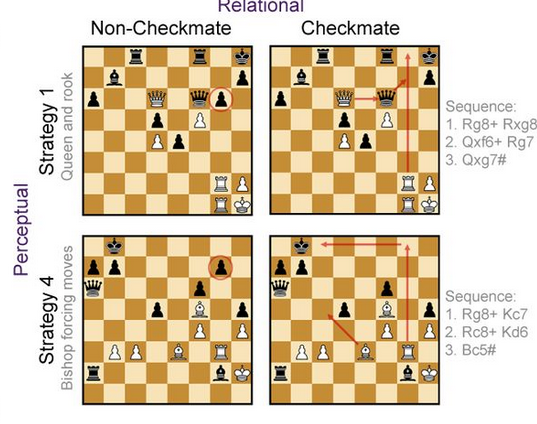 Adapted from Figure 2b of Constantino et al. (2025) - Examples of positions used in the experiment and their assignment to different categories.
This is neat both because it requires some serious care (and good chess knowledge!) to achieve and also because it means we can talk about the similarity between positions in this set of boards in different ways. Below, I'm showing you an example of an important tool the researchers use throughout their work to talk about the similarity between the items in this stimulus set: A Representational Dissimilarity Matrix (or RDM). This is a fancy term for a data object that isn't all that hard to understand - an RDM is basically a table where we write down how similar each pair of items in our set is.
To be more specific, imagine you wrote the numbers 1-40 down the rows of a sheet of graph paper and then wrote them again across the columns. Each single grid square inside that 40x40 area is a box where we can record how similar one pair of positions is. The box in the 3rd row and the 8th column is where we'd write down the similarity between Position #3 and Position #8, for example. Once we fill up all the boxes in this grid, we've got a complete RDM for the chess positions we're considering here. Because the three categories I described above each have a fixed set of labels (Checkmate vs. Non-Checkmate, for example) two positions can either be perfectly similar by having the same label, or perfectly dissimilar by having different ones.
Below you can see what the RDMs look like for these positions when we think about comparing them to one another in different ways. Depending on the category we're thinking about, the resulting RDM has very different structure! The Visual Similarity RDM has that diagonal line all the way from the top-left to bottom-right because every position is similar to itself, but has that pair of parallel lines because each board also has a single visual similarity buddy defined by changing just one piece. Every other pair of positions in the grid gets a low similarity score, while these get a high value. Checkmate vs. Non-Checkmate looks quite different though, because every "Checkmate" pattern has the same label as every other "Checkmate" pattern, which leads to those big quadrant-sized blocks you see.
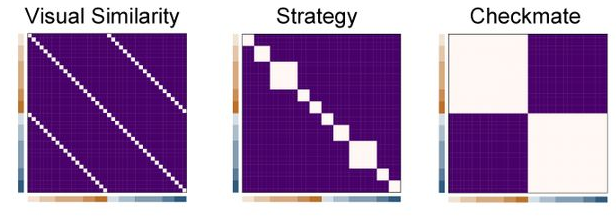 Adapted from Figure 2c of Constantino et al. (2025) - RDMs for all 40 chess positions according to different criteria for judging similarity.
The point of assembling these positions and building these matrices is to come up with a sort of language for talking about the relationships between all of the stimuli at once according to different rules. By itself, this is just kind of a neat exercise in thinking about some data (in this case, chess positions) in different ways, but the next step in this study is to use these grids as a starting point for examining expertise and the brain.
How similar are chess position in the player's mind?
Alright, to take stock of what the researchers have done so far, their first step was developing a way to measure similarity relationships between chess positions using different rules for comparing two boards. With those different relationships defined, their next step was to collect judgments from chess experts and non-experts about those positions so we can measure how similar they are are to one another in the mind of a player. To do this, participants were asked to complete a "1-back" task while having their brains scanned via fMRI.
In general, a"1-back" task refers to an experiment in which we show participants items in a sequence (one after the other) and ask them to continuously compare the item they're being presented with now to the one they saw just before (or one item "back" in the sequence). In a very simple 1-back task, you might ask participants to decide whether or not each item is identical to the one they saw a moment ago. In a more complicated task, you might show people lots of pictures of real-world objects and ask them to push a button every time the item they're looking at now would be more expensive to buy than the item they just saw. Researchers often use "1-back" tasks when they want to ensure that participants are paying attention to and evaluating every item they are presented with.
Here, the researchers asked their participants to complete a chess-based version of a "1-back" task using the 40 positions described above. During each block of the full experiment, participants saw 80 positions in a random sequence and were asked to push a button if the current board was a better position (for White) than the previous one. As you might imagine, this is pretty tough! Each board is only on screen for 2.5 seconds with a 1-second gap in between and they just keep coming until the full round of 80 positions is up.
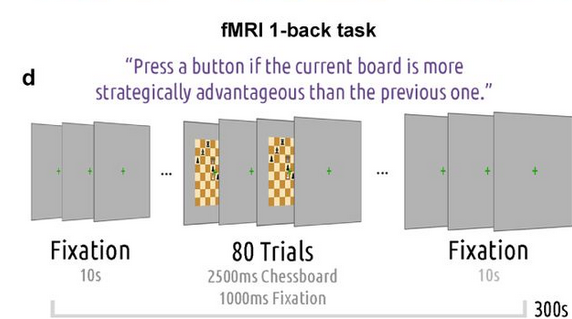 Adapted from Figure 2d of Constantino et al. (2025) - A schematic view of the 1-back task. Every time participants saw a position, their job was to decide if it was better than the previous one.
The point of doing this is two-fold. The first point is to establish a way of talking about the similarity between pairs of positions in this stimulus set based on what players say about them during a task that requires them to evaluate the position. The second point is to record the way different parts of the brain respond while participants carry out this process. We'll start by talking about how that first part works and then move on to talking about the brain.
The big idea here is that across all of our participants in the task, we can use their decisions about whether neighboring positions in the sequence were better than one another to talk about the similarity between boards using a new cognition-based rule. Imagine that we looked at all the times Position #10 was compared to Position #22 in our experiment and found out that participants were dead-even as to which one was better. That would suggest that these two positions are pretty similar! On the other hand, imagine that every time this pair showed up participants preferred Position #10. Now these two positions seem very dissimilar (because one is definitely worse). If we do this for every pair of positions that participants compared in our experiment, we can write down all those similarity numbers in a table just the same way we did when we were only thinking about the stimulus categories the researchers had built! That is, we can build an RDM based on participants' decisions about the boards.
 Adapted from Figure 3a of Constantino et al. (2025) - RDMs for all 40 chess positions according to experts' and novices' pairwise preferences for positions when presented in the 1-back task.
In the figure up above, you can see what that RDM looks like for both the experts (top row) and the novices (bottom row). Happily, this is one of those cases where the key results are sufficiently clear that I don't think I need to talk much about statistics. The first thing I hope you notice is that the experts look a LOT different than the novices. To be blunt, while the expert RDM has some obvious order to it, the novice RDM is just a big ol' mess. The second thing I hope you notice is the first interesting connection the researchers are making between different ways of characterizing chess positions. That expert RDM doesn't just have some kind of order to it, it has a very familiar order to it. Specifically, it looks very close to the RDM we saw for our Checkmate vs. Non-Checkmate similarity rule! That means that even though we didn't specifically ask participants to solve for mate, their preferences about the boards in our set ended up having the same structure as our sorting of the positions by Checkmate status.
Before you tell me this is obvious, I want to point out that this could have turned out differently. Players could have consistent preferences for different kinds of tactical motifs, for example, and picked Knight-and-Bishop boards over Queen-and-Rook boards. If they had done that we might have seen some hints of the Strategy rule in this RDM in addition to the Checkmate Rule. Even if that doesn't convince you, we're not done yet. There is one more bridge we can build with this data, and this one brings the board, the mind, and the brain together at once.
Where do we find different kinds of position similarity in the brain?
To do this, the authors use the last part of the data collected during their 1-back task that we haven't covered yet: The actual fMRI data recorded from participants' brains during the experiment. While participants were making their decisions about which positions they preferred, the researchers were also collecting measurements of the BOLD (blood oxygenation-level dependent) response across the brain. That means that for each board we have a new set of measurements: How active were different parts of the brain while participants were evaluating each position? The fMRI data provides us with a long list of numbers in each brain area that we can use to compare the responses to pairs of items. How would we do that? These lists can be used to calculate a distance (think your good old-fashioned Pythagorean Theorem but with lots more terms) and THAT means we can make a new RDM for each brain area that includes all of the positions: A bigger distance between boards means less similarity in neural response, while a small distance means greater similarity.
 Adapted from Haxby et al. (2014) - BOLD measurements in brain voxels yield a list of numbers that describe the neural response to each item we present to participants. Any two lists can be thought of as points in a high-dimensional space and we can thus calculate a distance between those points to estimate similarity.
Now we can ask if these brain-based RDMs share any of the structure we saw in our Strategy, Checkmate or Similarity RDMs. Instead of just using the eyeball test (like we did above for the behavioral data) to say that these look kind of the same, we can be more formal about it and actually measure a correlation between the values in the two RDMs we want to compare. A high value would mean lots of shared structure, while a low correlation value would mean very little.
Below, I've got some rather dense figures from the paper showing off what they found. In each figure, you'll see the correlations between the brain RDMs and one of the original similarity rules in a collection of different brain areas for experts and non-experts. Let's start with the Visual Similarity rule - what parts of the brain (if any) seem to process these positions just in terms of how they look?
 Adapted from Figure 4 of Constantino et al. (2025) - Correlations between neural RDMs obtained from each brain area and the Visual Similarity RDM we started with.
Interestingly, none of these correlations differed between experts and novices. Both groups show us that areas in the occipital lobe associated with visual processing have the most agreement with this rule. That's consistent with the idea that the Visual Similarity rule relfects fairly shallow sensory processing and thus doesn't have a lot to do with chess expertise. Let's take a look at the Strategy rule next.
 Adapted from Figure 4 of Constantino et al. (2025) - Correlations between neural RDMs obtained from each brain area and the Strategy RDM we started with.
Now things are getting kind of interesting! First, it's neat to see the shift in which parts of the brain share structure with our Strategy RDM. Instead of those visual areas in the back of the head, now there are parts of the parietal lobe associated with spatial processing, and also parts of the frontal cortex associated with motor planning and decision-making. Perhaps more importantly, those areas are also places where we see significant differences between experts and novices, to the tune of experts exhibiting that shared structure while novices kind of don't. Another thing I want to add here is a reminder that we couldn't see hints of the Strategy RDM in our behavioral data! I think that's a good demonstration of why considering these stimuli in terms of their formal structure, behavioral decisions AND neural responses is so cool in this study. Even though the Strategy RDM wasn't evident in the behavioral task, the researchers could measure that shared structure in specific parts of the brain.
 Adapted from Figure 4 of Constantino et al. (2025) - Correlations between neural RDMs obtained from each brain area and the Checkmate RDM we started with.
Finally, let's take a look at the Checkmate rule. This looks much the same as our Strategy analysis, incorporating areas for motion perception, motor imagery, and spatial processing that differ between experts and non-experts. All told, these results are a rich look at how expertise changes the expression of relationships between different chess positions across cortical sub-networks.
Expertise is sparse, but mighty
We're really only scratching the surface of everything the authors discuss in this paper, but I've already given you a lot of technical stuff to think about. I do want to close though, by coming back to the idea that sometimes we study chess scientifically because we want to use it to learn about another topic. So far, a lot of what I've shown you is pretty chess-specific - which parts of the brain support expert-level judgments about strategy vs. checkmate tactics? The authors didn't stop there, however, and move on to a number of neat analyses that further unpack what's going on in the expert brain. A lot of these would take a LOT of work to unpack for you, so I've got just one tidbit I want to leave you with instead.
If we go back to the idea of measuring what different parts of the brain do when presented with one of these chess positions, you may remember that I said this gave us a list of numbers we could use to describe that board using neural responses. If we had lots of numbers in that list (let's say one number from each of 1,000 brain voxels - the volume elements of fMRI), that would mean every board would be a point in a 1,000 dimensional space. What's more, if we recorded these neural responses for lots of different boards we'd end up with lot of points in this 1000D space. What kind of shape would those points make? To be more specific, would those points make a 3-dimensional shape like a ball, a 2-dimensional shape like a flat disc, or maybe even a 1-dimensional shape like a curve or line? The number of dimensions in the shape those points make up is related to something called the participation ratio, which the authors use here to further compare what expert brains do compared to novices when evaluating these chess positions. Below, you can see how this value looks across both groups in all the brain areas they considered here,
 Adapted from Figure 6 of Constantino et al. (2025) - Correlations between neural RDMs obtained from each brain area and the Visual Similarity RDM we started with.
The main takeaway is that the experts have a lower PR across the board for the most part. You can really see this in the bottom panel where the differences between experts and non-experts are being displayed across brain areas. The fact that almost all of these drop below the x-axis means experts have a lower value for this term than the novices with just a few exceptions.
What does this mean? That value tells us (we think) something about the efficiency of the neural responses to these items. In experts, the neural response is sort of streamlined, only involving a limited fraction of the full space available to describe boards using the neurons in each area. What's more, this is true even in the parts of the brain that appeared to participate in capturing the similarity structure of the Strategy and Checkmate rules! That means that the expert brain is able to do more than the novices and can do it with less. This is something that speaks to a potentially general feature of expertise that chess just happens to help us see.
Conclusions
Like I said, this is a rich and complex study with a ton of intriguing stuff in it. I hope I've given you a sense of how this research team used some very cool data science techniques to ask some really neat questions about expertise. While this isn't the kind of work that's going to give you insights into how to get better or a new perspective on how you play the game, the science of chess in this instance is helping us understand the nature of learning and expertise in the mind and brain.
If you made it this far, thanks for sticking with me! I spent a little more time than usual working towards this post, mostly because I thought it would be fun to tell you all about a study that incorporated some frontier techniques and went beyond some of the usual expert/novice comparisons. I hope you enjoyed it and stay tuned for more Science of Chess soon, hopefully without as long a break between posts.
Support Science of Chess posts!
Thanks as always for reading! If you're enjoying these Science of Chess posts and would like to send a small donation my way ($1-$5), you can visit my Ko-fi page here: https://ko-fi.com/bjbalas - Never expected, but always appreciated!
References
Andrea I. Costantino, Artem Platonov, Felipe Fontana Vieira, Emily Van Hove, Merim Bilalić, Hans Op de Beeck (2025) Low-Dimensional and Optimised Representations of High-Level Information in the Expert Brain, bioArXiv, doi: https://doi.org/10.1101/2025.11.12.688012
Recanatesi, S., Bradde, S., Balasubramanian, V., Steinmetz, N. A., & Shea-Brown, E. (2022). A scale-dependent measure of system dimensionality. Patterns (New York, N.Y.), 3(8), 100555. https://doi.org/10.1016/j.patter.2022.100555
Haxby, J. V., Connolly, A. C., & Guntupalli, J. S. (2014). Decoding neural representational spaces using multivariate pattern analysis. Annual review of neuroscience, 37, 435–456. https://doi.org/10.1146/annurev-neuro-062012-170325
McCarthy, J. (1990). Chess as the Drosophila of AI. In: Marsland, T.A., Schaeffer, J. (eds) Computers, Chess, and Cognition. Springer, New York, NY. https://doi.org/10.1007/978-1-4613-9080-0_14
You may also like
 Lichess
Lichess: End of Year Update 2025
Is it just us, or has this year flown by? As we say goodbye to 2025 and enter 2026, let's look back … ChessMonitor_Stats
Where do Grandmasters play Chess? - Lichess vs. Chess.com
This is the first large-scale analysis of Grandmaster activity across Chess.com and Lichess from 200… NDpatzer
Science of Chess: Seeing the board "holistically."
Better players may read a chessboard in the same ways we recognize faces. RuyLopez1000
Why Are People Good At Chess?
The Rise and Fall of Chunks NDpatzer
Science of Chess: Proving yourself wrong
The best players know it's not enough to be right, it's also working hard to find out when you're wr… TheCommandalorian